Supercharge Production ML With BentoML And Arize AI
Dec 15, 2022 • Written By Bo Jiang and Krystal Kirkland

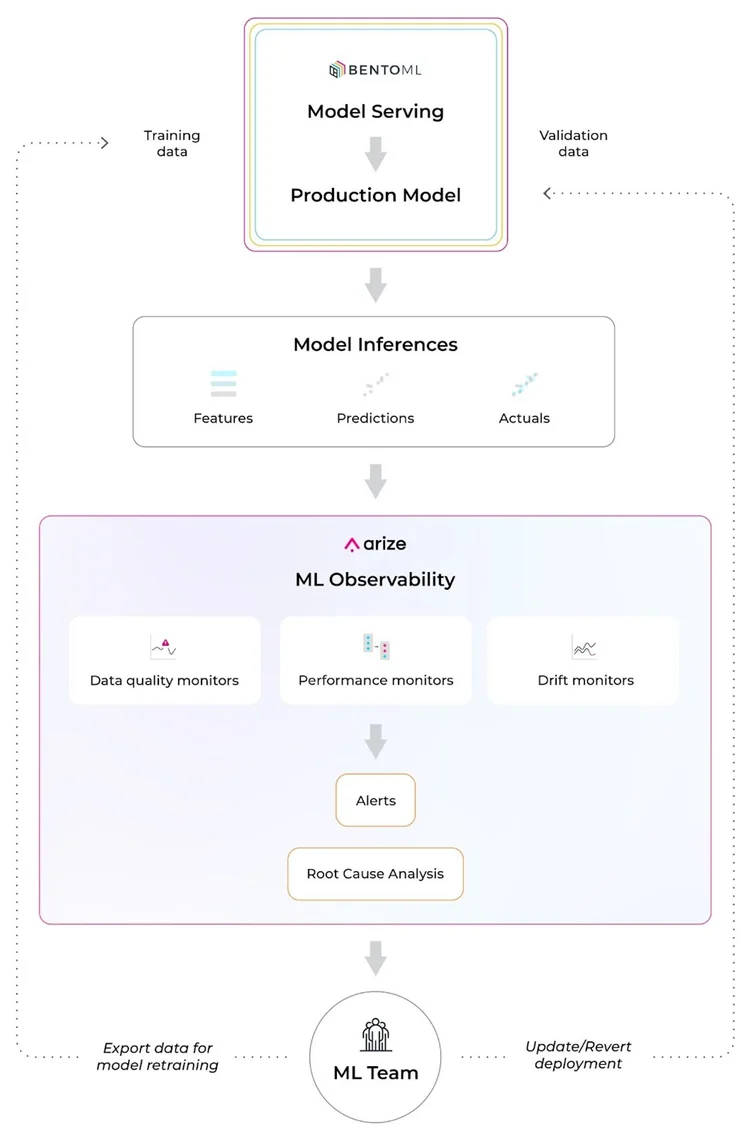
BentoML and Arize AI have partnered to streamline the MLOps toolchain and help teams build, ship, and maintain business-critical models. Leverage Bento’s ML service platform to easily turn ML models into production-worthy prediction services. Once your model is in production, use Arize’s ML observability platform to attain the necessary visibility to keep your model in production.
Learn how to use BentoML and Arize AI to
Accelerate training to deployment cycles
Build reliable, scalable, and high-performing models
Scale ML infrastructure as you grow with a purpose-built integration
Training/Serving Skew
Due to the nature of real-world data, production environments are highly dynamic and change over time, especially compared to training environments. This causes performance degradations that can wreak havoc on your model outcomes.
For example, during the height of the pandemic, U.S. home price prediction models dramatically drifted because the typical real estate buying pattern and available inventory rapidly changed. Due to an increased demand for larger homes to accommodate urban sprawl and a decreased supply of homeowners willing to sell, home price predictions were impacted by changes in both distributions of the ‘size’ feature (feature drift) and per-square footage price of large homes (concept drift).
Most changing user behaviors are hard to pinpoint and happen when you least expect it. Failing to detect decaying models can negatively impact your customer’s experiences, reduce revenue, perpetuate systemic bias, and much more. In other words, even if you were confident in your production model when it was first deployed, your model performance can change at any time as subject to the ever-changing production environment. Thus, it’s imperative to monitor for model, feature, and performance degradation before it’s too late.
Arize AI Co-Founder and CPO, Aparna Dhinakaran, recently spoke about ML observability and drift detection in depth during an AMA session in the BentoML community Slack.
How To Ship A Model With Bento And Enable ML Observability
The 2022 BentoML community survey revealed that more than 50% of respondents are interested in monitoring their model performance after they have at least one model running in production. Once you’ve shipped your model with BentoML, implement ML observability with Arize AI to monitor and troubleshoot your performance degradation in real time. Get alerted when your model deviates from expected ranges and automatically surface your problematic areas within your model to proactively catch and resolve model issues before they impact your customers.
Integrate BentoML and Arize AI in a few easy steps:
Step 1: Build an ML application with BentoML
Step 2: Serve ML Apps & Collect Monitoring Data
Step 3: Export and Analyze Monitoring Data
Step 1: Build An ML Application With BentoML
Using a simple iris classifier bento service, save the model with BentoML’s API once we have the iris classifier model ready.
If you’re new to BentoML, get started here.
train.py
from sklearn import svm
from sklearn import datasets

# Load training data
iris = datasets.load_iris()
X, y = iris.data, iris.target

# Model Training
clf = svm.SVC()
clf.fit(X, y)

# Save model to BentoML local model store
import bentoml
saved_model = bentoml.sklearn.save_model("iris_clf", clf)
print(f"Model saved: {saved_model}")
This will save a new model in the BentoML local model store and automatically generate a new version tag. View all model revisions from CLI via bentoml models
commands:
$ bentoml models get iris_clf:latest $ bentoml models list
We recommend running ML model inference in serving via Runner. Draft a service definition and use the saved models as runners.
service.py
import numpy as np
import bentoml
from bentoml.io import Text
from bentoml.io import NumpyNdarray

CLASS_NAMES = ["setosa", "versicolor", "virginica"]

iris_clf_runner = bentoml.sklearn.get("iris_clf:latest").to_runner()

svc = bentoml.Service("iris_classifier", runners=[iris_clf_runner])

@svc.api(
    input=NumpyNdarray.from_sample(np.array([4.9, 3.0, 1.4, 0.2], dtype=np.double)),
    output=Text(),
)
async def classify(features: np.ndarray) -> str:
    results = await iris_clf_runner.predict.async_run([features])
        result = results[0]
    category = CLASS_NAMES[result]
    return category
Use bentofile to declare the dependencies.
bentofile.yaml
service: "service.py:svc"
python:
  packages:
    - scikit-learn
    - pandas
Once we have the BentoML service ready, we can start the development server and test the API through this command.
$ bentoml serve .
Before moving the service to production, we’ll add monitoring logging capability with the code below. The bentoml.monitor API logs the request features and predictions.
service.py
import numpy as np

import bentoml
from bentoml.io import Text
from bentoml.io import NumpyNdarray

CLASS_NAMES = ["setosa", "versicolor", "virginica"]

iris_clf_runner = bentoml.sklearn.get("iris_clf:latest").to_runner()
svc = bentoml.Service("iris_classifier", runners=[iris_clf_runner])


@svc.api(
    input=NumpyNdarray.from_sample(np.array([4.9, 3.0, 1.4, 0.2], dtype=np.double)),
    output=Text(),
)
async def classify(features: np.ndarray) -> str:
    with bentoml.monitor("iris_classifier_prediction") as mon:
        mon.log(features[0], name="sepal length", role="feature", data_type="numerical")
        mon.log(features[1], name="sepal width", role="feature", data_type="numerical")
        mon.log(features[2], name="petal length", role="feature", data_type="numerical")
        mon.log(features[3], name="petal width", role="feature", data_type="numerical")

        results = await iris_clf_runner.predict.async_run([features])
        result = results[0]
        category = CLASS_NAMES[result]

        mon.log(category, name="pred", role="prediction", data_type="categorical")
    return category
To conclude this step, we’ll build a bento (BentoML Application) for the service above.
$ bentoml build .
██████╗░███████╗███╗░░██╗████████╗░█████╗░███╗░░░███╗██╗░░░░░
██╔══██╗██╔════╝████╗░██║╚══██╔══╝██╔══██╗████╗░████║██║░░░░░
██████╦╝█████╗░░██╔██╗██║░░░██║░░░██║░░██║██╔████╔██║██║░░░░░
██╔══██╗██╔══╝░░██║╚████║░░░██║░░░██║░░██║██║╚██╔╝██║██║░░░░░
██████╦╝███████╗██║░╚███║░░░██║░░░╚█████╔╝██║░╚═╝░██║███████╗
╚═════╝░╚══════╝╚═╝░░╚══╝░░░╚═╝░░░░╚════╝░╚═╝░░░░░╚═╝╚══════╝

╭───────╮   ██████╗░███████╗███╗░░██╗████████╗░█████╗░███╗░░░███╗██╗░░░░░
│       │   ██╔══██╗██╔════╝████╗░██║╚══██╔══╝██╔══██╗████╗░████║██║░░░░░
│  ● ●  │   ██████╦╝█████╗░░██╔██╗██║░░░██║░░░██║░░██║██╔████╔██║██║░░░░░
│       │   ██╔══██╗██╔══╝░░██║╚████║░░░██║░░░██║░░██║██║╚██╔╝██║██║░░░░░
╰───────╯   ██████╦╝███████╗██║░╚███║░░░██║░░░╚█████╔╝██║░╚═╝░██║███████╗
            ╚═════╝░╚══════╝╚═╝░░╚══╝░░░╚═╝░░░░╚════╝░╚═╝░░░░░╚═╝╚══════╝


                  ()
      ________    //
 ()  |╲       ╲  //
  \\__ ╲       ╲//
   \__) ╭───────╮
     |  │       │
      ╲ │  ● ●  │
       ╲│       │
        ╰───────╯
        //    \\
       ((     ||
        \\    ||
      ( ()    ||
              () )

Successfully built Bento(tag="iris_classifier:6aqnksdbuouf2usu").
Step 2: Serve ML Apps & Collect Monitoring Data
BentoML provides a set of APIs, and CLI commands for automating cloud deployment workflow, which gets your BentoService API server up and running on any platform.
Navigate to the full deployment guide here for various deployment destinations.
Use this command to start a standalone server.
$ bentoml serve iris_classifier --production
BentoML will default export the data to the monitoring/<your_monitor_name> directory.
For example, you can view the log file like this.
$ tail -f monitoring/iris_classifier_prediction/data/*.log
==> monitoring/iris_classifier_prediction/data/data.1.log <==
{"sepal length": 6.3, "sepal width": 2.3, "petal length": 4.4, "petal width": 1.3, "pred": "versicolor", "timestamp": "2022-11-09T15:31:26.781914", "request_id": "10655923893485958044"}
{"sepal length": 4.9, "sepal width": 3.6, "petal length": 1.4, "petal width": 0.1, "pred": "setosa", "timestamp": "2022-11-09T15:31:26.786670", "request_id": "16263733333988780524"}
{"sepal length": 7.7, "sepal width": 3.0, "petal length": 6.1, "petal width": 2.3, "pred": "virginica", "timestamp": "2022-11-09T15:31:26.788535", "request_id": "9077185615468445403"}
{"sepal length": 7.4, "sepal width": 2.8, "petal length": 6.1, "petal width": 1.9, "pred": "virginica", "timestamp": "2022-11-09T15:31:26.795290", "request_id": "1949956912055125154"}
{"sepal length": 5.0, "sepal width": 2.3, "petal length": 3.3, "petal width": 1.0, "pred": "versicolor", "timestamp": "2022-11-09T15:31:26.797957", "request_id": "5892192931675972870"}
{"sepal length": 5.1, "sepal width": 3.5, "petal length": 1.4, "petal width": 0.3, "pred": "setosa", "timestamp": "2022-11-09T15:31:26.801006", "request_id": "11124174524929195678"}
{"sepal length": 5.4, "sepal width": 3.4, "petal length": 1.7, "petal width": 0.2, "pred": "setosa", "timestamp": "2022-11-09T15:31:26.805018", "request_id": "1977947867380701804"}
{"sepal length": 5.4, "sepal width": 3.0, "petal length": 4.5, "petal width": 1.5, "pred": "versicolor", "timestamp": "2022-11-09T15:31:26.809391", "request_id": "5170522495321543267"}
{"sepal length": 6.5, "sepal width": 3.2, "petal length": 5.1, "petal width": 2.0, "pred": "virginica", "timestamp": "2022-11-09T15:31:26.813963", "request_id": "746111233619919779"}
{"sepal length": 5.4, "sepal width": 3.7, "petal length": 1.5, "petal width": 0.2, "pred": "setosa", "timestamp": "2022-11-09T15:31:26.816515", "request_id": "10451493838968794158"}

==> monitoring/iris_classifier_prediction/data/data.2.log <==
{"sepal length": 5.6, "sepal width": 2.5, "petal length": 3.9, "petal width": 1.1, "pred": "versicolor", "timestamp": "2022-11-09T15:31:26.768545", "request_id": "12581333339958540887"}
{"sepal length": 4.5, "sepal width": 2.3, "petal length": 1.3, "petal width": 0.3, "pred": "setosa", "timestamp": "2022-11-09T15:31:26.770188", "request_id": "14803218836235991321"}
{"sepal length": 6.3, "sepal width": 2.9, "petal length": 5.6, "petal width": 1.8, "pred": "virginica", "timestamp": "2022-11-09T15:31:26.771554", "request_id": "3898998431725264845"}
{"sepal length": 4.7, "sepal width": 3.2, "petal length": 1.6, "petal width": 0.2, "pred": "setosa", "timestamp": "2022-11-09T15:31:26.775306", "request_id": "16171654492399963820"}
{"sepal length": 4.9, "sepal width": 3.0, "petal length": 1.4, "petal width": 0.2, "pred": "setosa", "timestamp": "2022-11-09T15:31:26.778971", "request_id": "12433921846139166785"}
{"sepal length": 6.9, "sepal width": 3.1, "petal length": 5.4, "petal width": 2.1, "pred": "virginica", "timestamp": "2022-11-09T15:31:26.783441", "request_id": "3868728687839356795"}
{"sepal length": 5.1, "sepal width": 3.4, "petal length": 1.5, "petal width": 0.2, "pred": "setosa", "timestamp": "2022-11-09T15:31:26.803871", "request_id": "4920762203256166127"}
{"sepal length": 4.5, "sepal width": 2.3, "petal length": 1.3, "petal width": 0.3, "pred": "setosa", "timestamp": "2022-11-09T15:31:26.807770", "request_id": "562712759995883379"}
{"sepal length": 5.1, "sepal width": 3.8, "petal length": 1.6, "petal width": 0.2, "pred": "setosa", "timestamp": "2022-11-09T15:31:26.810136", "request_id": "15755243536090754018"}
{"sepal length": 6.4, "sepal width": 3.1, "petal length": 5.5, "petal width": 1.8, "pred": "virginica", "timestamp": "2022-11-09T15:31:26.812188", "request_id": "15915060852312696387"}
Step 3: Export And Analyze Monitoring Data
Leveraging BentoML’s monitoring logging API, you can set up the inference logging pipeline to Arize in a few lines of code.
1. Add Bentoml-Plugins-Arize To The Bento’s Dependencies
First, add bentoml-plugins-arize to the bentofile configuration.
bentofile.yaml
service: "service.py:svc"
python:
  packages:
    - scikit-learn
    - pandas
    - bentoml-plugins-arize  # <--- add this dependency
2. Apply Bentoml-Plugins-Arize In The Deployment Configuration
Update the deployment configuration to connect to the Arize account.
bentoml_deployment.yaml
monitoring:
  enabled: true
  type: bentoml_plugins.arize.ArizeMonitor
  options:
    space_key: <your_space_key>
    api_key: <your_api_key>

    # ... more arize options
        # see https://docs.arize.com/arize/data-ingestion/api-reference/python-sdk/arize.init#keyword-arguments
    # and https://docs.arize.com/arize/sending-data-to-arize/data-ingestion-methods/sdk-reference/python-sdk/arize.log
Attain the space_key and the api_key with the instructions here.
3. Rebuild The Bento And Make A New Deployment
Run the command to start serving as a standalone server.
$ BENTOML_CONFIG=bentoml_deployment.yaml bentoml serve iris_classifier --production
After completing the setup, your online inference log will flow to the Arize platform!
4. Monitor, Troubleshoot, And Resolve Production Issues With Arize AI
Step 1: Set Up Monitors
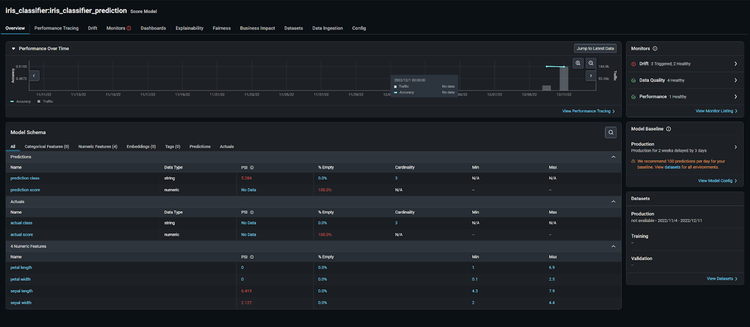
If you haven’t yet, get started using Arize for free here! Once we log on to the platform, we can see our iris_classifier:iris_classifier_prediction model on the ‘Models’ page.
This page contains an overview of all your models for an at-a-glance health check across the board.
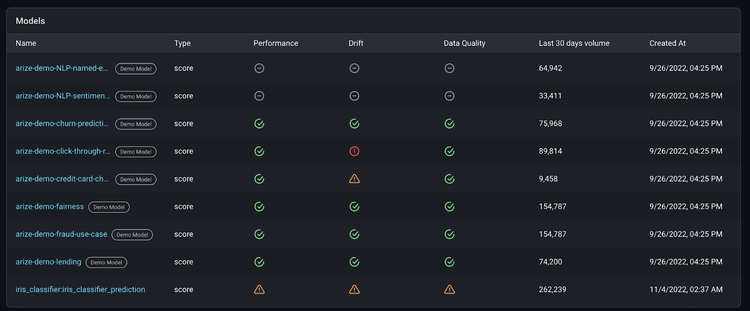
All Arize accounts come with demo models to showcase different use cases and workflows. To overview a common troubleshooting workflow, let’s look at setting up the arize-demo-fraud-use-case model. Our main objective is to learn how to improve our model and export those findings back to BentoML for retraining.

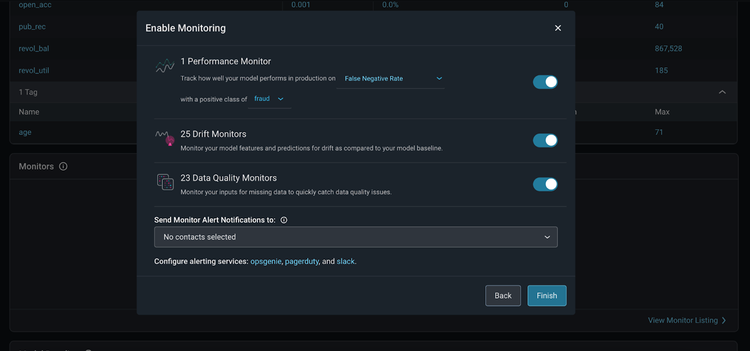
Once your model data is in the Arize platform, enable monitors in Arize to catch drift, data quality, and performance issues. Arize supports three main types of monitors:
Performance Monitors:
Model performance indicates how your model performs in production. Measure model performance with an evaluation metric which can be evaluated with daily or hourly checks on metrics such as Accuracy, Recall, Precision, F1, MAE, MAPE, and more.
Drift Monitors:
Drift monitors measure distribution drift, which is the difference between two statistical distributions. Since models are trained with polished data to represent production environments, it’s common for real-world production data to deviate from training parameters over time. Drift can be a great leading indicator into model performance.
Data Quality Monitors:
Model health depends on high-quality data that powers model features, so it’s important to ensure your data is always in tip-top shape. Data quality monitors help identify key data quality issues such as cardinality shifts, data type mismatch, missing data, and more.
To easily set up all three monitors, we’ll follow the automatic bulk creation workflow by clicking the ‘Set Up Monitors’ button on the ‘Model Overview’ page.
Here are further instructions on how to set up model monitoring in the Arize platform.
Step 2: Monitoring Alerts
Once our monitors are set, Arize monitors trigger an alert when your monitor crosses a defined threshold, notifying you that your model has deviated from expected ranges. You can configure your own threshold or set an automatic threshold.
Learn how to configure a threshold.
Arize offers alerting integrations for alerting tools and methods. Send an alert via email, slack, OpsGenie, and PagerDuty. Within these tools, you can add configurations to edit your alerting cadence, severity, and alert grouping.
Step 3: Troubleshoot Your Model
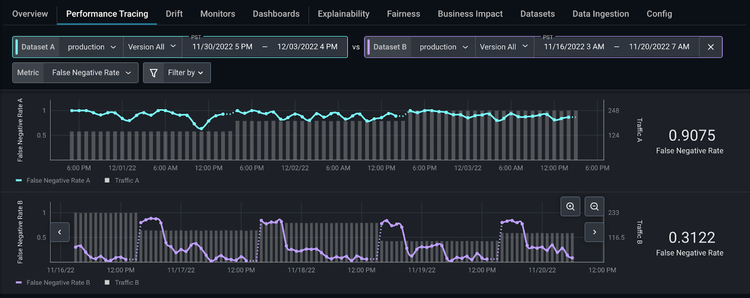
When your model deviates from the threshold, use the performance tracing tab to troubleshoot the features and slices that affect our model the most.

Add a high-performing comparison dataset from any model version or environment to easily identify the root cause of our performance issue. In our case, zoom in on a high-performing section of our production dataset and compare that with a low-performing section of our production dataset.
From here, Arize automatically surfaces the slices that affect your model performance the most on the ‘Performance Insights’ card. Click on state = CA to compare how this slice behaves differently between the two datasets.
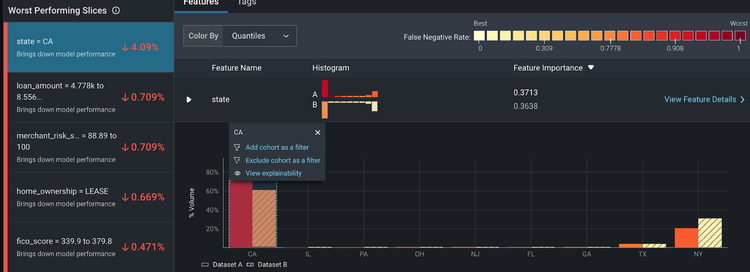
Here, we can see some discrepancies between training and production. Within the ‘Feature Details’ page, we can view additional details on how our distribution comparison changes over time. This provides a granular view of how our slices change over time – informing if your features have drifted significantly, your overall data quality, and a distribution comparison of your slices.

Explore More With The BentoML & Arize AI Community
Build reliable, scalable, and high-performing models with BentoML and Arize AI. Use our purpose-built integration to scale your ML infrastructure stack for a seamless production model workflow.
If you enjoyed this article, please show your support by ⭐ the BentoML Project on GitHub, join the BentoML’s Slack Community and the Arize AI Slack Community. Searching for a great place to run your ML services? Check out BentoML Cloud for the easiest and fastest way to deploy your bento. Want to deliver and maintain better ML in production? Sign up for a free Arize account to quickly detect issues when they emerge, troubleshoot why they happened, and improve overall model performance across both structured and unstructured data.