A Guide To ML Monitoring And Drift Detection
Apr 11, 2023 • Written By Jiang Bo

While many businesses have learned to rely on machine learning as a core component for their growth, these ML services have a much different operational lifecycle than traditional software services. They are prone to different types of drift over time depending on the scenario and most require specialized, ongoing monitoring to ensure they continue to perform as intended.
In this blog post, we will explore the importance of monitoring your ML services, the challenges associated with it and how to get started regardless of your use case.
Why Is Monitoring Important?
Most production ML services are used to predict outcomes on live input. This live input is inherently subject to variability. The difficulty with ML services is that this variability can be natural or the result of factors which were unaccounted for in training.
For example, during the COVID pandemic a variety of forecasting models were trained to help public health officials make informed decisions on the type of intervention required depending on the spread of the virus. However, as data collection and testing protocols improved at different rates, the predictions began to degrade in accuracy.
Another example occurred just last year, when Unity Software reported that one of their ML services had degraded causing them to lose ad revenue. The result was a massive hit to their market cap during a stock selloff that could have been avoided with better monitoring.
These are only a couple of the public mishaps due to the lack of monitoring. We at BentoML, often hear similar stories in the field where ML services without proper monitoring are the cause for unnecessary service degradation.
What Are The Challenges?
Monitoring ML services is different than monitoring a traditional web application. This is because implementing a useful monitor strategy generally requires knowledge of the business as well as the data to prioritize which monitoring challenges to tackle first.
The following are key concepts to understand and account for when designing your monitoring strategy. While you will need to make the final decision on which challenges to prioritize based on your use case, we will attempt to give some practical guidance as well.
Output data drift
Predictions results, otherwise known as “outputs”, are a very practical way to begin to determine if your ML service is beginning to degrade. Many experts in the field agree that alarming on some basic statistical thresholds is a great way to start monitoring your ML service.
Simple strategies such as monitoring the predicted distributions or the length of generated text can sufficient to issue an early warning that the model may be experiencing drift. Because these types of implementations do not require very complex drift-detecting algorithms, they can be a very low cost way to start monitoring.
Performance drift
Model performance is another way of referring to whether a prediction was correct. For example if the model is predicting whether a person has cancer or not, the performance is determined by whether the person actually had cancer, which can only be determined from further testing and a doctor’s confirmation. Further confirmation as to whether the prediction was correct is often called “ground truth”. Ground truth in many cases is said to be a labeling problem because many times the only way to tell is if a person confirms if the prediction was true.
Because ground truth can often involve a human feedback loop, it can often be expensive to implement and subject to a good deal of latency given that ground truth could be received much later. Performance drift occurs when the number of correct predictions that the model is generating begins to degrade.
In cases where prediction results can be correlated to ground truth, we often see users sending prediction results to a data warehouse or an external tool where it may be joined with ground truth once it is received.
Input data drift
Input data drift refers to incoming data which is not consistent with the data which the model was trained. This can happen due to changes in data provider feeds or changes in the industry. The following are a few common ways that you can detect this type of drift in real-time.
• Monitor feature distribution: If data drift occurs, the distribution of features will also change. Comparing the feature distribution in different time periods or different datasets can determine if data drift has occurred.
• Monitor data statistics: Data drift can also cause changes in statistical information such as mean and variance. Comparing the statistical information of data in different time periods or different datasets can determine if data drift has occurred.
• Monitor domain expertise: If prediction results that are inconsistent with domain knowledge are observed in the application data, data drift may have occurred. For example, in the financial industry, if a model detects a large number of abnormal transactions in a client's account, it may be necessary to reconsider whether the model needs to be adjusted.
• Use unsupervised learning: Unsupervised learning can be used to explore the intrinsic structure and patterns of data. If the prediction results of a supervised learning model on new data are significantly different from the results of an unsupervised learning model, data drift may exist.
These techniques can also apply to detecting output drift as well.
Concept drift
Concept drift is a more subtle form of drift that is commonly found in fields strongly correlated with public concepts, such as natural language processing and recommendation systems. For example, in 2019 "corona" usually referred to a halo-like gas layer around the sun, moon, or other celestial bodies, or to the "corona effect" in electrical engineering. However, since the outbreak of the COVID-19 pandemic at the end of 2019, this word often refers to the virus.
Suppose a classification model was trained before 2019; it is more likely to associate "corona" with solar activity. It is easy to see that this kind of drift cannot be found in the comparison between the model and the baseline generated before it, as in data drift.
An effective method is to regularly re-label data and compare it with the baseline.
How To Get Started Monitoring?
BentoML makes it easy to start monitoring your service from the beginning. Out of the box a variety of operational metrics are supported which can be used for traditional monitoring. In addition we’ll talk more about custom ML monitoring metrics in second installment in this series on monitoring.
As a generalized technique for monitoring a wide variety of use cases BentoML provides an API built for monitoring models. This feature allows users the flexibility of identifying the data that they care about and then shipping it to a centralized location where they can use a variety of monitoring techniques based on what fit their needs.
This strategy works especially well for enterprises that have established data pipelines where it is important to integrate model monitoring into an existing monitoring workflow.
Identifying Prediction Data
The first step in monitoring your ML service is to identify the data which is important for monitoring. BentoML provides a BentoML provides a monitoring api which can be used to ship data to a variety of destinations like a data warehouse or a specialized monitoring tool like Arize AI.
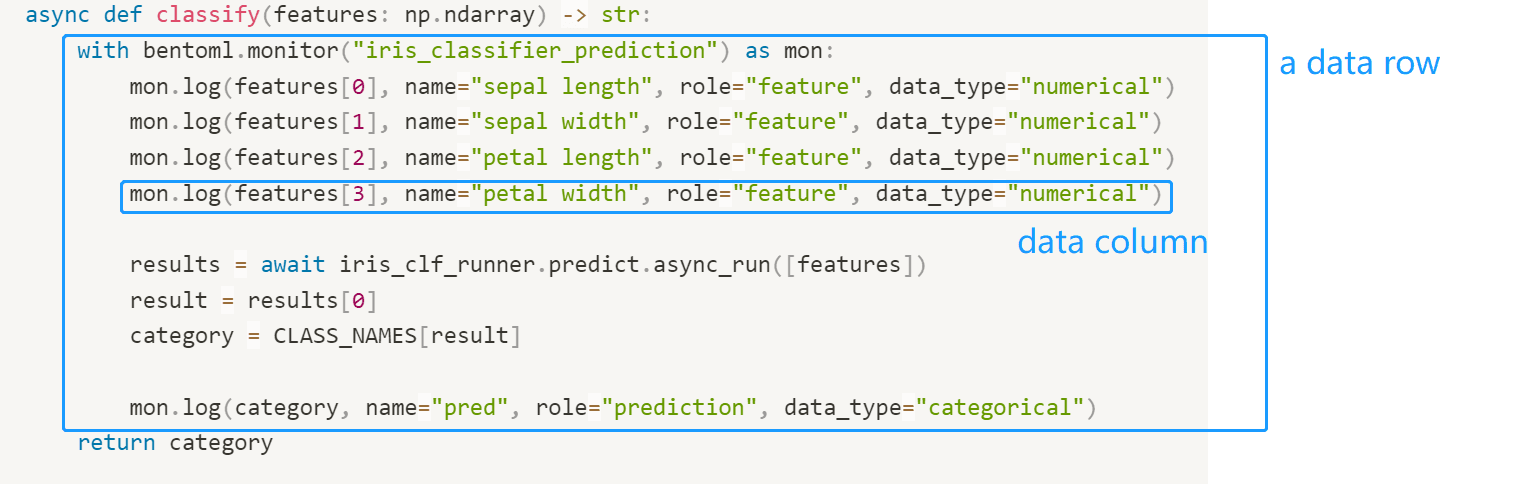
Below shows an example of BentoML’s monitoring api and how to use it to record data:
import numpy as np
import bentoml
from bentoml.io import Text
from bentoml.io import NumpyNdarray

CLASS_NAMES = ["setosa", "versicolor", "virginica"]

iris_clf_runner = bentoml.sklearn.get("iris_clf:latest").to_runner()

svc = bentoml.Service("iris_classifier", runners=[iris_clf_runner])

@svc.api(
    input=NumpyNdarray.from_sample(np.array([4.9, 3.0, 1.4, 0.2], dtype=np.double)),
    output=Text(),
)
async def classify(features: np.ndarray) -> str:
    with bentoml.monitor("iris_classifier_prediction") as mon:
        mon.log(features[0], name="sepal_length", role="feature", data_type="numerical")
        mon.log(features[1], name="sepal_width", role="feature", data_type="numerical")
        mon.log(features[2], name="petal_length", role="feature", data_type="numerical")
        mon.log(features[3], name="petal_width", role="feature", data_type="numerical")

        results = await iris_clf_runner.predict.async_run([features])
        result = results[0]
        category = CLASS_NAMES[result]

        mon.log(category, name="prediction", role="prediction", data_type="categorical")
    return category
The code above uses the monitor object to call the log() method which allows users to identify features and prediction information. The data type can be one of the following: ["numerical", "categorical", "numerical_sequence"], and the role can be one of ["feature", "prediction", "target"].
Users can then configure how to export this data in the **configuration.yml** file.
monitoring:
  enabled: true
  type: default
  options:
    log_path: path/to/log/file
By default BentoML appends this data to a log file, but can also be configured to send to specific tools. The following are a couple of the ways which users may configure the monitoring.
• Manually in notebook code example
Shipping Prediction Data
Once the correct data is identified and passed to the monitoring api there are a variety of ways to ship this data to your intended destinations. Depending on your development and deployment stack you could use a tool like Fluentbit or Filebeat to read the file which the monitoring api is writing to and send the data to a supported destination.
If you were using AWS cloudwatch there are different ways to stream that data to warehouses where you can do further analysis. This data is also important for creating continuous retraining loops which help to keep your model up to date and avoid drift.
BentoML’s hosted solution Bento Cloud makes this step easy by allowing users to specify a fluentbit configuration and where it is then automatically provisioned and deployed with your bento. This allows users to easily collect and ship data from their online services to any destination they choose like s3 bucket storage or a data warehouse like Google BigQuery.
Even if you decide not to ship your data to another location for analysis, Bento Cloud provides an out of the box monitoring dashboard so that you can ensure your service is healthy.
Analyzing Prediction Data
There are a variety of techniques and tools for analyzing the data once it has been aggregated which are out of the scope of this article, but here is a quick example using open source libraries (pandas and scipy) to detect drift with Kolmogorov-Smirnov (KS) Tests.
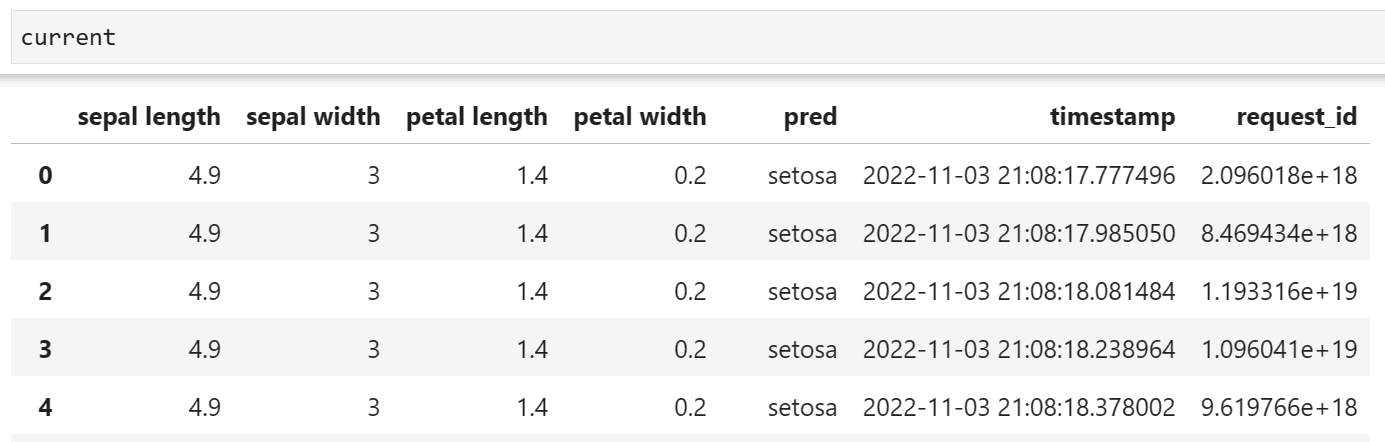
Here we aggregate a list of files using pandas dataframes:
import pandas as pd
import glob

files = glob.glob("monitoring/{your_service_n_monitor_name}/data/*")
frames = [pd.read_json(fn, lines=True) for fn in files]
current = pd.concat(frames)
In our example, this is what the dataframe looks like:
Next, you will need to prepare a baseline which to compare against. In many cases this could be the previous week’s worth of data or a subset of data which was used during training. Then we use kstest from scipy to compare the baseline with the latest data to determine a p_value which should give us an idea if drift is being detected.
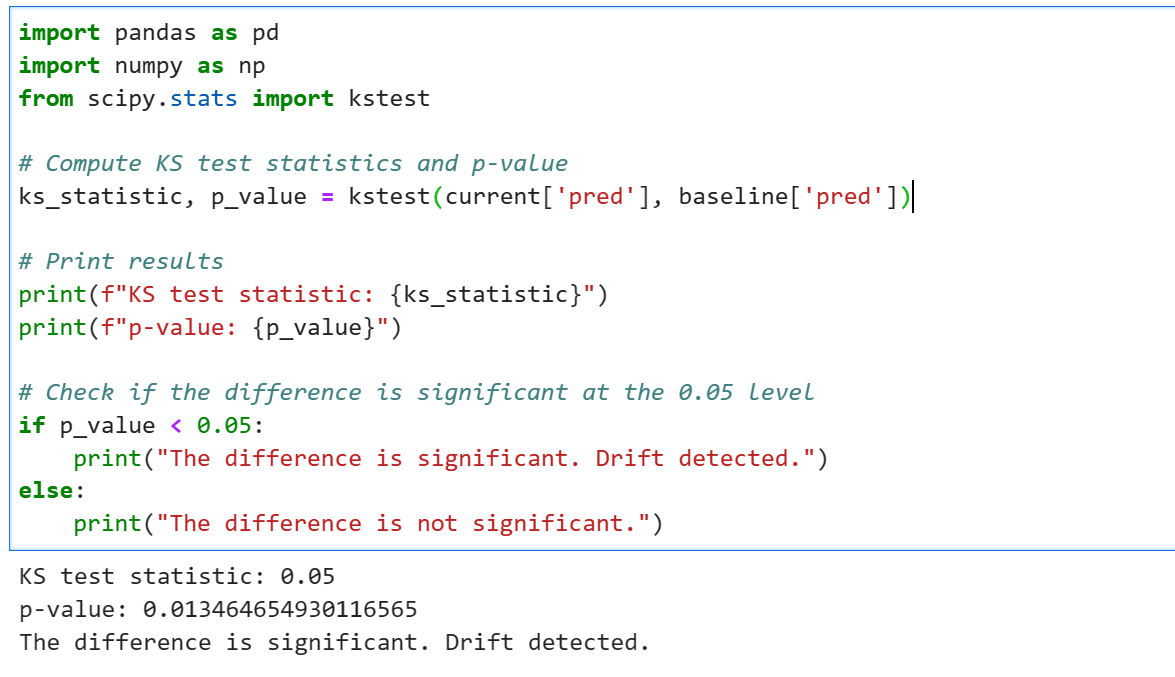
 If your data resides in a warehouse like BigQuery or Snowflake, you can also use SQL to run the KS Test using SQL or other available DSLs. Once you have your test working, it can be run on a regular basis to alert users if there may be an issue with drift.
Keeping Your ML Services Reliable
In conclusion, model monitoring is an essential component of the machine learning lifecycle, especially in production environments. By regularly monitoring your models, you can ensure that they continue to produce accurate and relevant predictions, detect and correct for concept drift, and maintain the reliability of your machine learning services.
BentoML is dedicated to providing the best tools for running ML in production. Our open-source framework, offers a scalable, easy-to-use method for monitoring your machine learning services. Bento Cloud’s managed service takes advantage of this standard by automatically provisioning resources to continuously monitor the quality of your services to detect and alert users when different types of drift occur.
By following these best practices, enterprises can ensure that their machine learning services remain reliable, accurate, and high-performing over time.